Work with reports in Pythagoras
Reports provide a consistent way to view, customize, and export data from drawings, databases, DTM models, and search results. All reports use the same layout engine, so you work with columns, tabs, layouts, and exports in the same way regardless of the report type.
Pythagoras provides several report types, including:
| Coordinate List | View > Reports > Coordinate List |
| Object List | View > Reports > Object List |
| Table List | View > Reports > Table List |
| Found Objects | Edit > Find & Select > New or Ctrl+F |
| Volume Calculation Report | DTM > Volumes, then Export |
| Road Design Cut and Fill Report | Road Design: Calculations > Cut and Fill > Export Result |
You have the following possibilities to adjust the report's appearance and save the result.
→ Navigate and edit report content
Navigate and edit report content
Reports can open in a tabbed layout. Each tab contains a table with columns you can adjust and export.
Tabs
When exporting, Pythagoras exports every visible report tab in sequence. When exporting a report with multiple tabs, Pythagoras adds them to the drawing or file one after the other.
With the Plus  and Minus
 (Remove active tab out of the report) buttons you can add and remove tabs specific to the current report.
Column adjustments
Reorder columns: click and drag a column header.
Resize columns: drag the edge between two headers.
Hide a column: set its width to 0.
Sort a column: click its header.
Adjust layout and text 
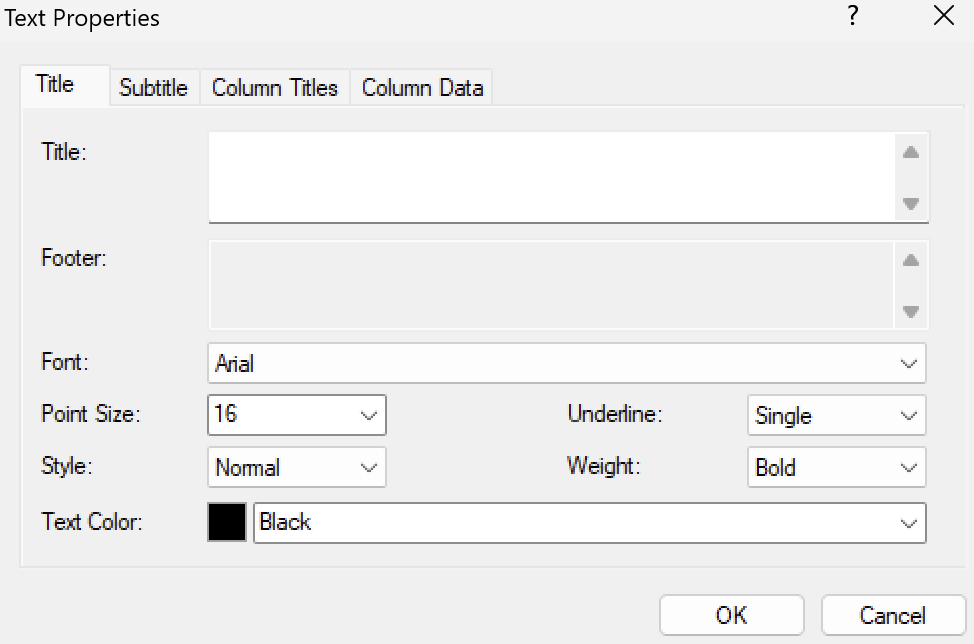
Edit text attributes
Use the Edit text attributes button to open a dialog where you can set font, size, alignment, and column properties. You can also add a title and footer here.
TIP: The units and decimal places of the report are controlled in Settings > Preferences: Units.
Save layout of the report 
Click Save Layout to store the current report layout as a template in the Pythagoras system file. The saved layout is automatically reused the next time you open the same report.
Restore default layout
Click Restore to discard unsaved layout changes and return to the previously saved layout or o the default system layout.
Export a report 
You can export reports in different ways:
Export to Drawing
Go to Export to > Drawing. A Rich Text object will be created in Page Coordinates. Double-click the table to edit it in the Rich Text Editor.Export to File
Export to formats such as.rtf,.html,.csv,.txt(tab separated), or.txt(semicolon separated).Export to Clipboard
Click Export to > Clipboard, then paste usingCtrl+Vinto Word, Excel, or another application.
Tip: During export to drawing or file, the dialog stays open so you can double-check your layout.
Since reports are table-based, you can also copy-paste them into spreadsheets or word processors.
Any exported text file can be edited in Pythagoras using the Rich text editor. It has a table format and can be copy-pasted into any spreadsheet and/or word-processing program.
Select objects from reports
In Table List and Found Objects reports, you can create a drawing selection directly from the report.
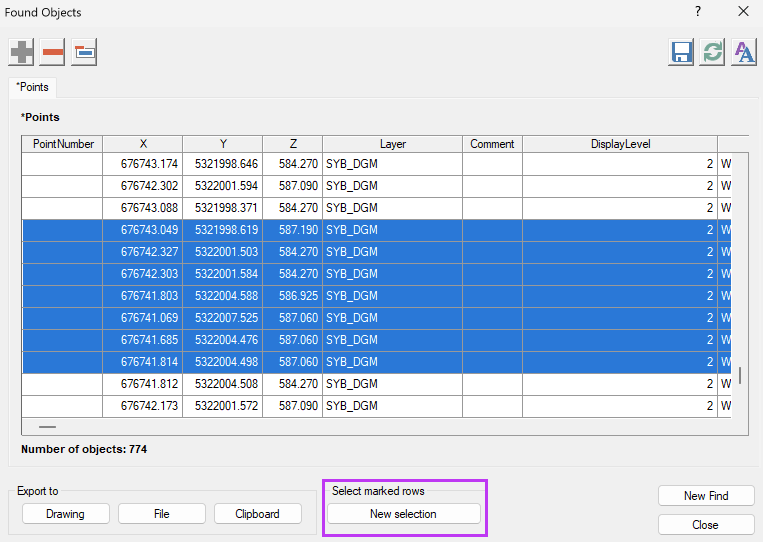
- Select one or more report rows.
- Click New Selection.
The objects linked to the selected rows become the active selection in the drawing.
If no rows are selected, New Selection selects the objects for all rows in the active report tab.
Click Unmark All Rows  to clear the selected report rows.
You can also create Coordinate list (points) and Object list (objects) reports directly from the Right mouse menu after selecting points or objects.
Was this article helpful?
That’s Great!
Thank you for your feedback
Sorry! We couldn't be helpful
Thank you for your feedback
Feedback sent
We appreciate your effort and will try to fix the article